Lesson 4 of 12 · ~7 min
Activate the Live Monitor
You'll learn: Promote a scan to a real-time Command Bridge view that auto-polls signals every 15 minutes through event end.
A saved event from Lesson 1 (or any event in /events with a future start time).
01 When to activate
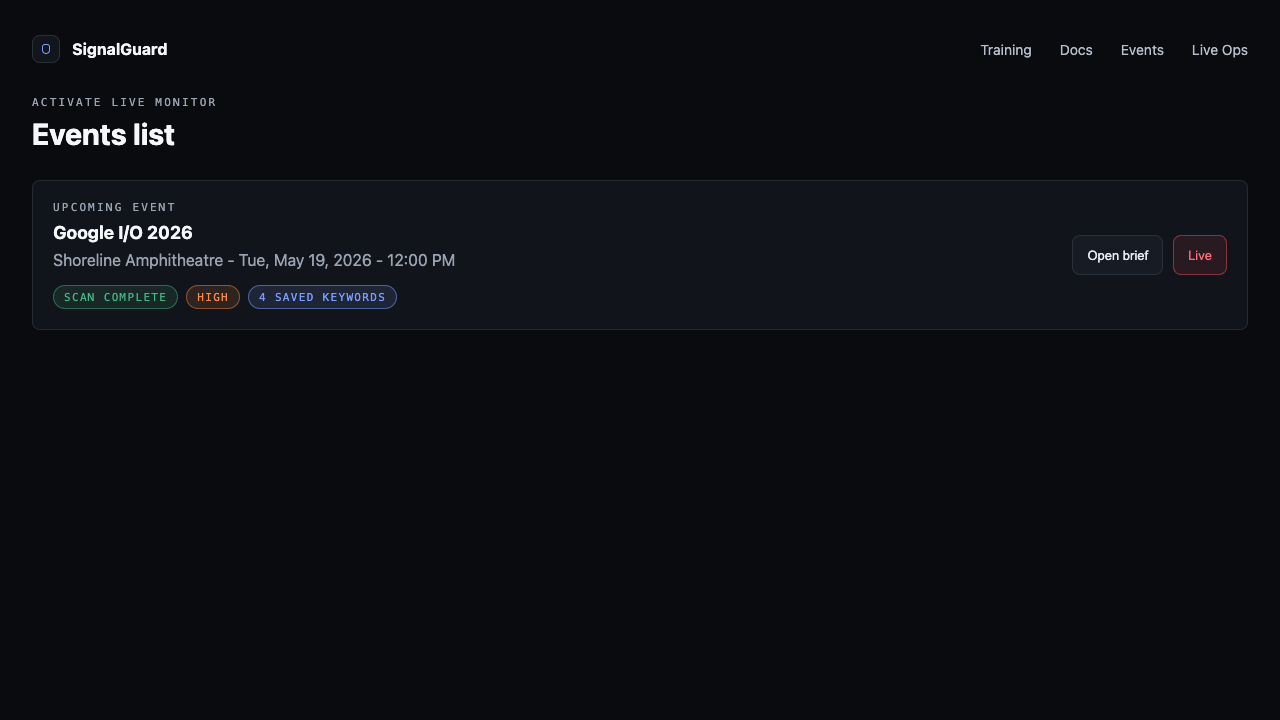
Live Monitor turns on automatically 1 hour before the event Start time (T-1h) and stays active through End + 2h. You can also activate manually any time after a successful scan — useful when something develops earlier than expected.
Manual activation: go to /events, find the event card, and click the Live button. Or from a fresh brief, click Activate live monitoring.
02 Read the header
The page top shows: event name (H1), venue address, date range, then the eyebrow with a countdown to start/end. Below that, the state pill (Normal / Active Incident) sits on the left of an actions row with Handoff, Settings, and Ask Co-Pilot buttons on the right.
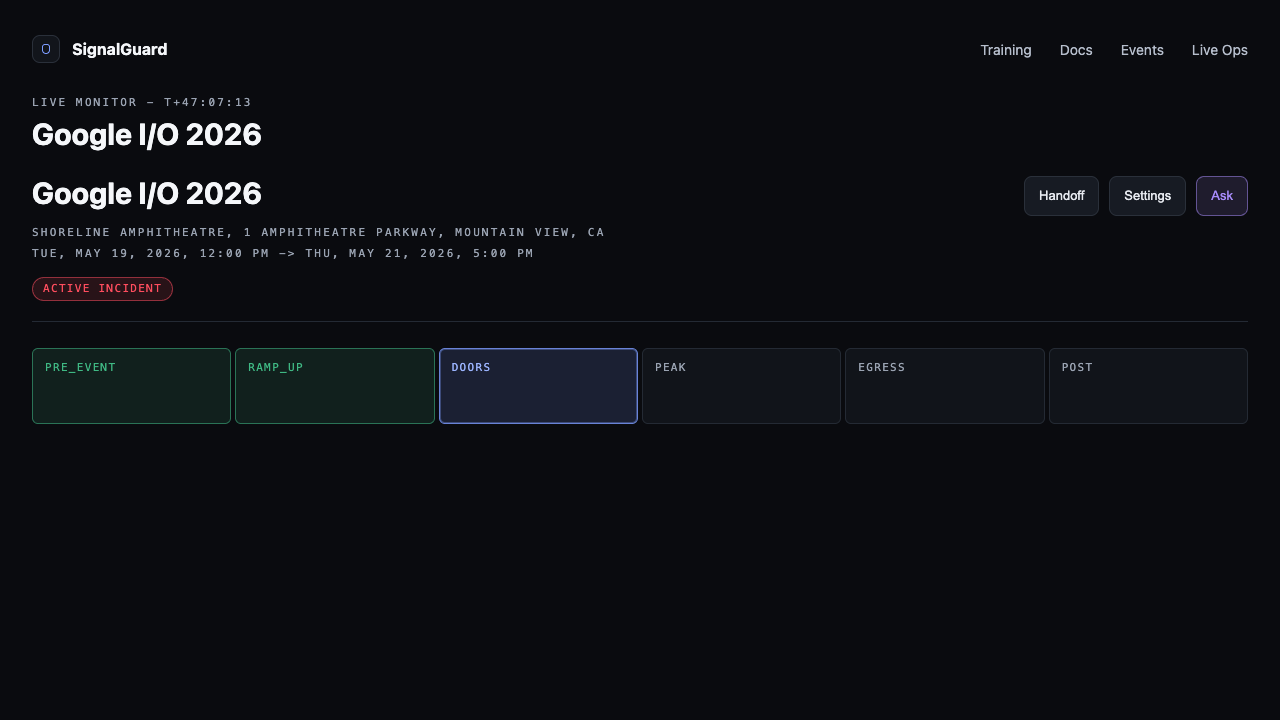
03 The phase strip
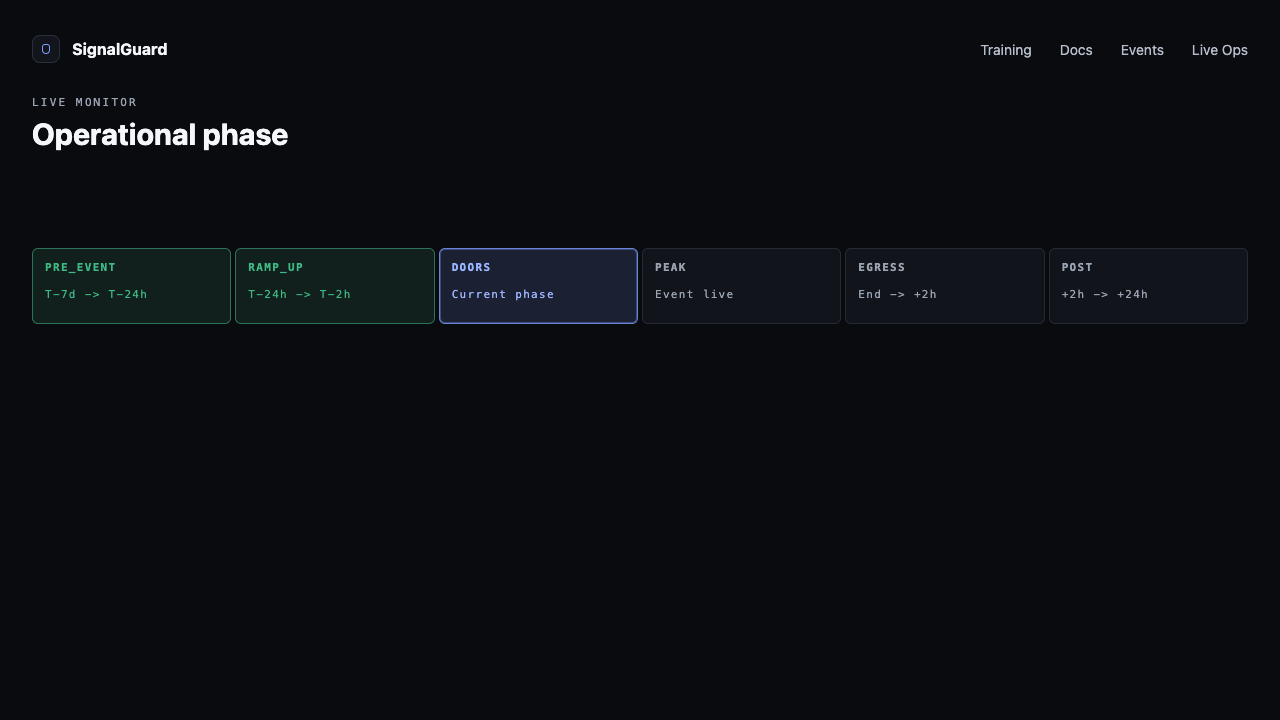
A 6-cell strip under the header tracks where the event sits in its operational lifecycle. Past phases turn dim green; the current phase glows accent blue.
- PRE_EVENT — T-7d → T-24h. Baseline scanning.
- RAMP_UP — T-24h → T-2h. Increased polling cadence.
- DOORS — T-2h → T-30m. Highest sensitivity to movement signals.
- PEAK — T-30m → end. Chatter and incident-response priority.
- EGRESS — end → end + 2h. Crowd-dispersal monitoring.
- POST — end + 2h → end + 24h. Catch any next-day chatter.
04 The Posture panel
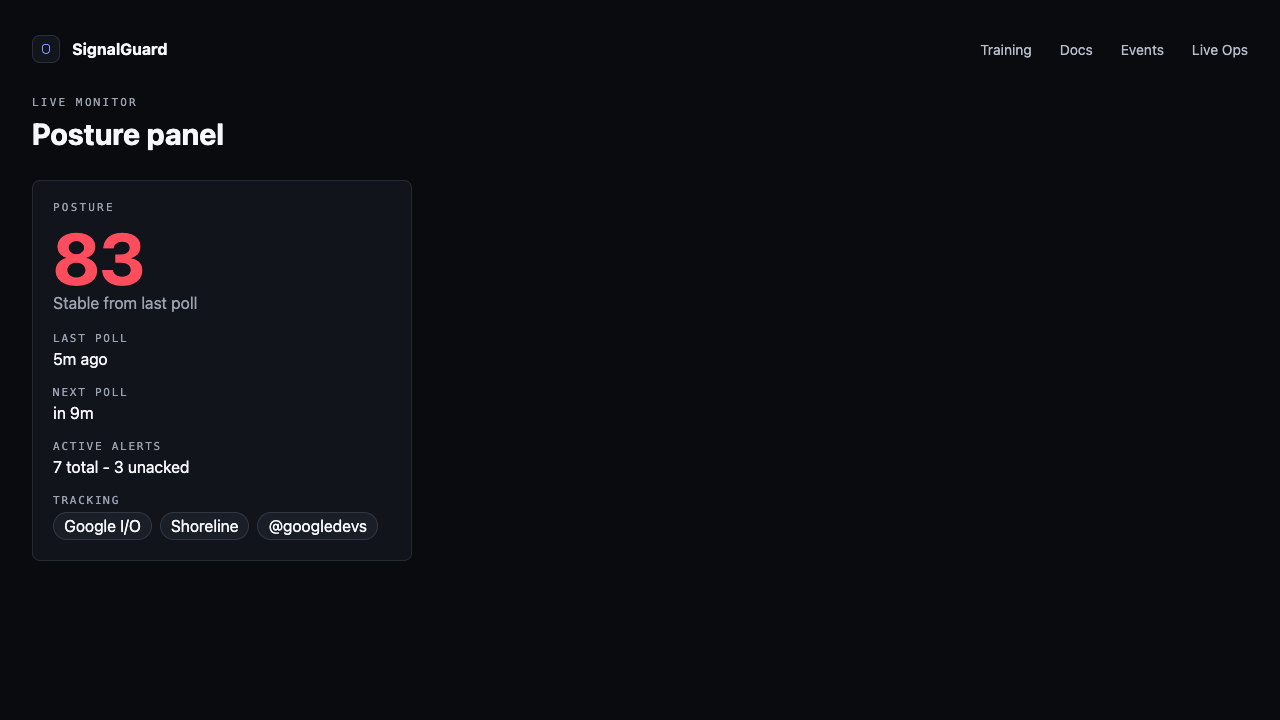
The left column is your at-a-glance status:
- Posture score — composite 0-100, color-matched to severity.
- Last poll — relative time of most recent signal fetch.
- Next poll — countdown to the next 15-minute cron tick.
- Active alerts — total fired + how many you haven't acknowledged.
- Tracking — chips for the keywords this monitor is scanning chatter for.
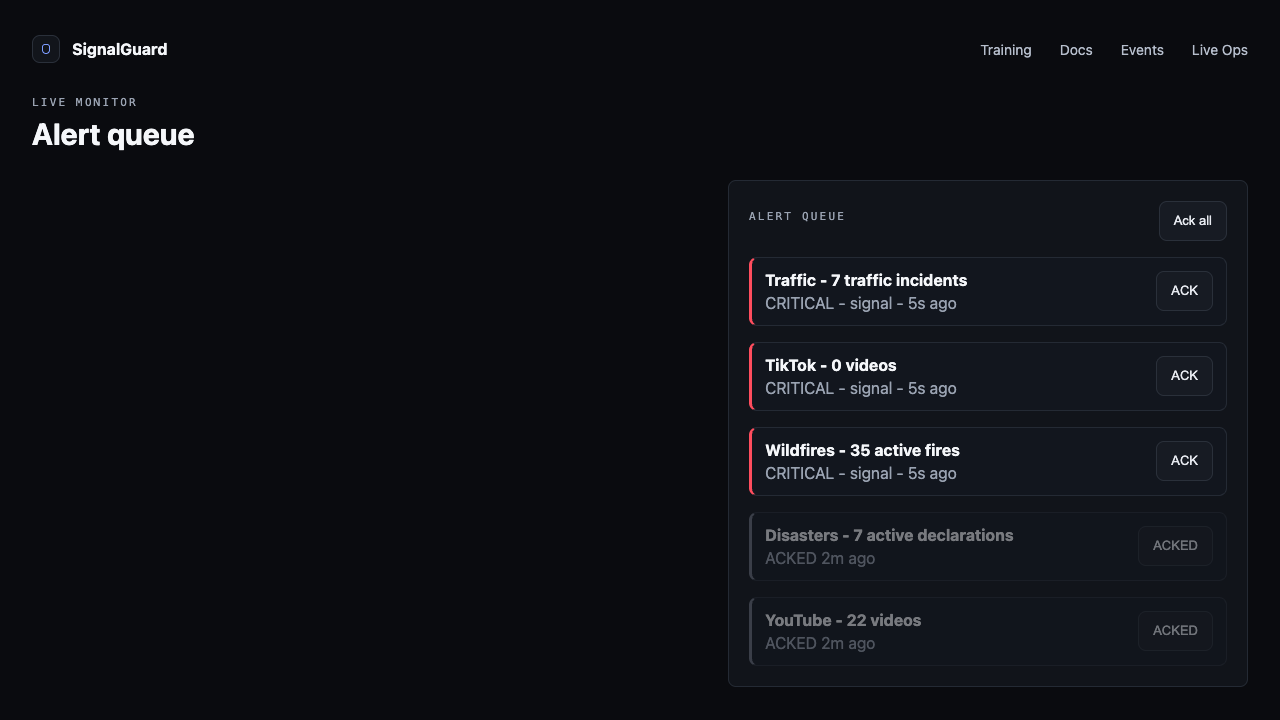
05 Acknowledge alerts
The right column is the alert queue. Each alert links to the originating signal — click to open the detail card and acknowledge it. Acks are per-monitor and shared across operators on the same account, so a handoff doesn't dump a colleague back into a full inbox.
Tips
- Polling stops automatically at end + 2h. To keep monitoring after that (rare — usually for post-event chatter analysis), extend the End time on /event settings.
- The Handoff button copies a shareable URL for the incoming operator. Same page, no re-auth needed.
- If signals stop updating, check Posture's "Last poll" — if it's been more than ~20 minutes the cron may have stalled. Refresh the page.